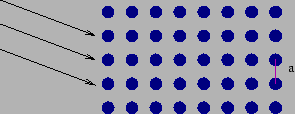
X-ray is incident on a crystal as shown in Figure 13.1. The oscillating electric field of this electromagnetic wave induces a oscillating dipole moment in every atom or molecule inside the crystal. These dipoles oscillate at the same frequency as the incident X-ray. The oscillating dipoles emit radiation in all directions at the same frequency as the incident radiation, this is known as Thomson scattering. Every atom scatters the incident X-ray in all directions. The radiation scattered from different atoms is coherent. The total radiation scattered in any particular direction is calculated by superposing the contribution from each atom.
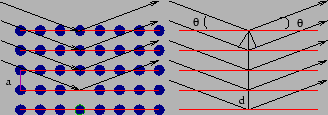
For a crystal where the atoms have a periodic arrangement, it is convenient to think of the three-dimensional grating as a set of planes arranged in a one-dimensional grating as shown in Figure 13.2.
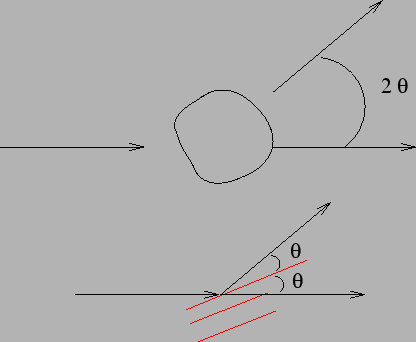
Consider X-ray incident at a grazing angle of ![]() as shown in
Figure 13.2. The intensity of the reflected X-ray will be
maximum when the phase difference between the waves reflected from two
successive planes is
as shown in
Figure 13.2. The intensity of the reflected X-ray will be
maximum when the phase difference between the waves reflected from two
successive planes is ![]() or its integer multiple.
This occurs when
or its integer multiple.
This occurs when
| (13.1) |
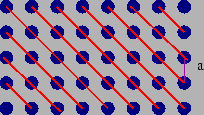
The spacing between the planes ![]() is different in the two cases and
the maxima will occur at a different angle. The first set of planes
are denoted by the indices
is different in the two cases and
the maxima will occur at a different angle. The first set of planes
are denoted by the indices ![]() and the second set by
and the second set by
![]() . It is, in principle, possible to have a large number of
such planes denoted by the indices referred to as the Miller
indices. The distance between the planes is
. It is, in principle, possible to have a large number of
such planes denoted by the indices referred to as the Miller
indices. The distance between the planes is
Figure 13.4 shows a schematic diagram of an X-ray
diffractometer. This essentially allows us to measure the diffracted
X-ray intensity as a function of ![]() as shown in Figure
13.4.
as shown in Figure
13.4.
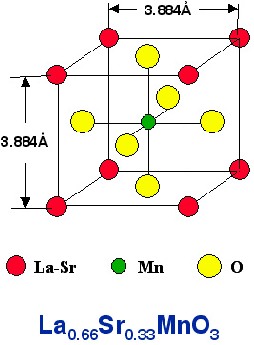
Figure 13.5 shows the unit cell of
![]() .
X-ray of wavelength
.
X-ray of wavelength
![]() is used in an X-ray diffractometer, the resulting
diffraction pattern with intensity as a function of
is used in an X-ray diffractometer, the resulting
diffraction pattern with intensity as a function of ![]() is
shown in Figure 13.6.
is
shown in Figure 13.6.
The ![]() values of the first three peaks have been tabulated
below. The question is how to interpret the different peaks. All the
peaks shown correspond to
values of the first three peaks have been tabulated
below. The question is how to interpret the different peaks. All the
peaks shown correspond to ![]() ie. first order diffraction
maximas, the higher orders
ie. first order diffraction
maximas, the higher orders ![]() are much fainter. The different
peaks correspond to different Miller indices which give different
values of
are much fainter. The different
peaks correspond to different Miller indices which give different
values of ![]() (eq. 13.2). The maxima at the smallest
(eq. 13.2). The maxima at the smallest ![]() arises from the largest
arises from the largest ![]() value which correspons
to the indices
value which correspons
to the indices
![]() . The other maxima may be interpreted
using the fact that
. The other maxima may be interpreted
using the fact that ![]() and
and ![]() are inversely related.
are inversely related.
| 1,0,0 | |
| 1,1,0 | |
| 1,1,1 |